
Your %GRR came back fine. The number of distinct categories didn't. Here's what ndc is actually telling you, and where to look before you touch the gage.
It's a common moment of confusion in a measurement-system review: %GRR reads 12%, comfortably inside the "may be acceptable" range, and then ndc reads 3. The two numbers seem to disagree. They don't — they're answering different questions, and the second one is often the more important answer for your process.
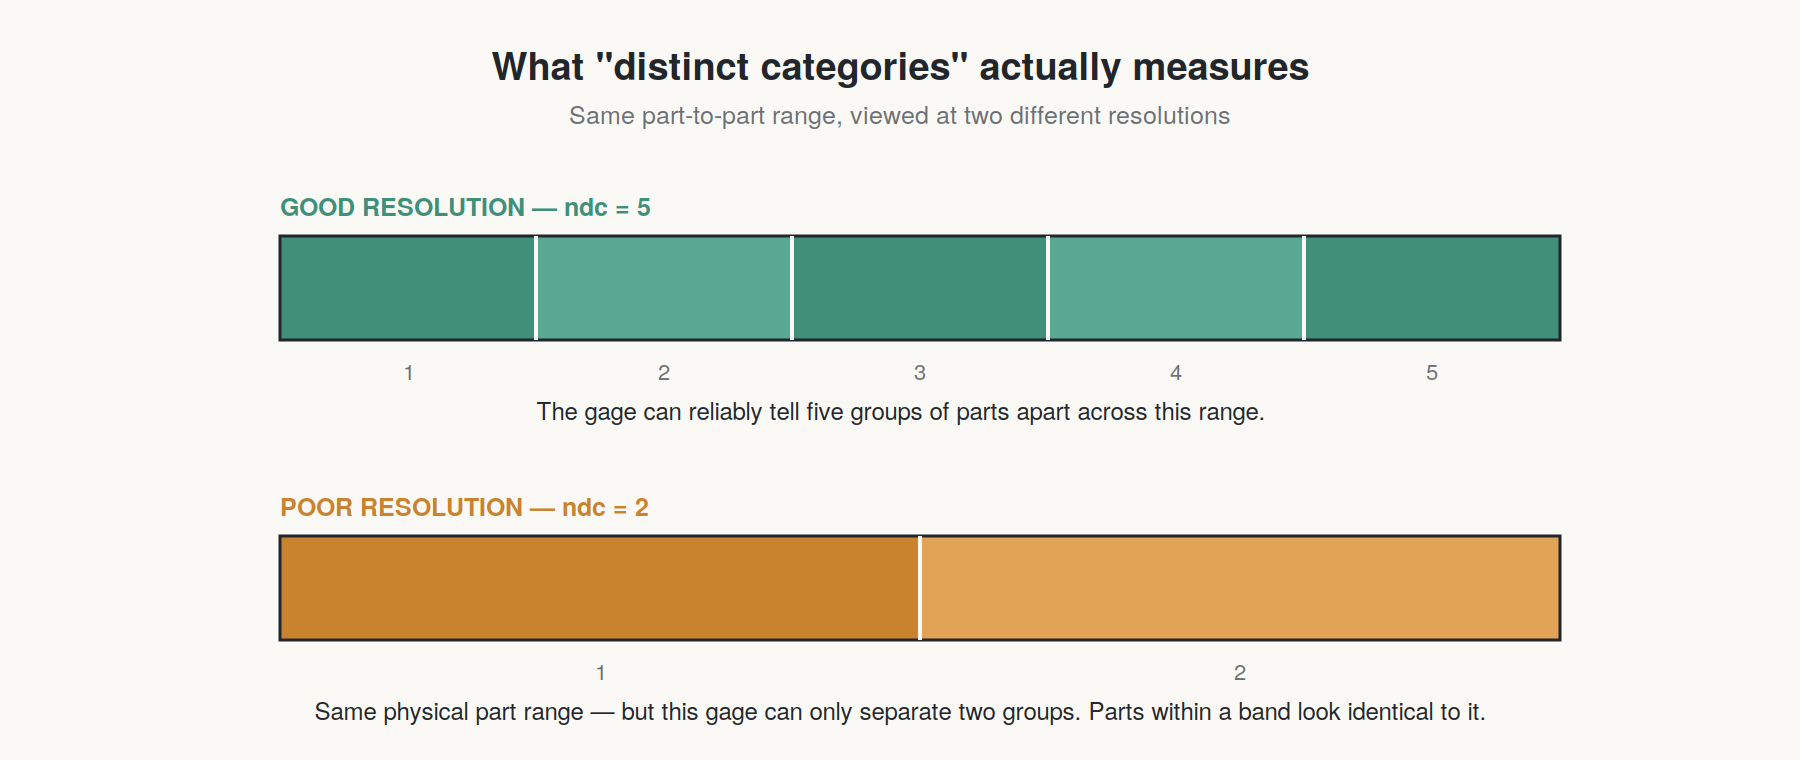
What ndc is actually measuring
%GRR tells you how much of the variation in your data comes from the measurement system versus the parts themselves. ndc (number of distinct categories) tells you something more concrete: how many genuinely separable groups your gage can tell apart across the range of parts you studied.
An ndc of 3 means your measurement system can reliably sort parts into roughly three buckets — low, medium, high — and nothing finer than that. If your process needs to distinguish parts that are closer together than that, on the same gage, you're asking the measurement system to do a job its resolution can't support, regardless of what %GRR says.
The AIAG guideline of ndc ≥ 5 exists because below that point, a control chart or capability study built on this gage's data will misrepresent the process. You can have low measurement variation as a percentage and still not have enough categories, particularly when your parts don't vary very much to begin with.
Why this happens even when %GRR looks fine
Ndc is calculated from the ratio of part variation to measurement variation, scaled by a constant (1.41 × PV ÷ RR). Three situations commonly produce a low ndc with an otherwise acceptable %GRR:
The parts studied didn't span the process's real range. If your Gage R&R sample was pulled from a narrow band of production instead of the full spread of variation the process actually produces, PV will be artificially small — and ndc drops even though the gage itself is fine. This is the single most common cause, and the easiest to fix: re-run the study with parts deliberately selected to cover the process's full observed range, not just "whatever was on the bench."
The gage's resolution is close to the part-to-part variation. If your tolerance is 0.10 mm and your gage reads to the nearest 0.01 mm, you're working with only 10 discrete readings across the full tolerance band — not enough room for 5+ distinct categories even with perfect repeatability. The rule of thumb here is a gage resolution of at least 1/10th of the tolerance, though tighter is better for anything with real ndc requirements.
The characteristic itself has genuinely low part-to-part variation. Sometimes the process is simply very tight — which is good news for capability, but it means there's less part variation for the gage to distinguish. In this case, ndc is a real, structural limitation, not a fixable flaw in the study.
What to check, in order
- Confirm the parts sampled represent full process range, not a narrow production batch. Re-pull parts if needed.
- Compare gage resolution to tolerance. If it's coarser than about 1/10th of tolerance, that's a hardware limitation, not a study problem.
- Recalculate ndc after fixing part selection before concluding the gage itself is inadequate.
- If ndc is still low with a properly spread sample and adequate resolution, treat it as a genuine constraint — the process may be too tight for this characteristic to need fine discrimination at all, which is worth confirming with engineering before spending money on a better gage.
Ndc below 5 isn't automatically a failed study. It's a prompt to check whether you're measuring the actual spread of your process — and once you know that, the %GRR number and the ndc number usually stop disagreeing.
Run your own numbers: the free Gage R&R calculator computes %GRR, %Tolerance, and ndc together from your study data, so you can see how they move against each other before drawing conclusions.