Verify the evidence source
Use Gage R&R to estimate repeatability, reproducibility, and the system’s ability to distinguish parts.
Quality engineering connects three different questions: can the measurement be trusted, is the process stable, and can that stable process meet specification? This hub organizes every existing Mechatrovich article, tool, product, and service around that decision sequence.
Measurement System Analysis identifies how much observed variation comes from the measurement process. Statistical Process Control examines behavior over time. Process capability compares the stable distribution with engineering specification limits. The pages below connect the explanation, worked evidence, calculation tools, complete products, and higher-touch review options already available on Mechatrovich.
Determine whether the measurement system can distinguish real part-to-part variation before using the data to judge the process.
Repeatability, reproducibility, %GRR, ndc, and the reasoning behind acceptance.
Read the MSA overview →WORKED STUDYA complete crossed study using 90 measurements, ANOVA, diagnostic charts, and an acceptability decision.
Review the worked evidence →DIAGNOSTICWhy ndc can remain low even when %GRR appears acceptable—and what to check first.
Diagnose a low ndc result →INTERPRETATIONWhy a trustworthy gage can correctly report that the process does not meet specification.
Separate measurement from capability →After measurement adequacy is understood, use process order and rational subgroups to separate routine variation from special-cause signals.
Subgroup logic, A2/D3/D4 calculations, control limits, and a worked 25-subgroup example.
Learn the Xbar-R method →INTERPRETATIONA clean control chart means stable behavior—not automatic specification fit.
Separate stability from capability →Once the data is trustworthy and the process is stable, compare process spread and centering with the engineering specification.
Potential capability, actual centering, formulas, graphs, assumptions, and practical interpretation.
Understand Cp and Cpk →CROSS-METHOD DECISIONA passing measurement study and a low Cpk answer different questions and can both be correct.
Read the combined interpretation →CROSS-METHOD DECISIONWhy statistical control does not prove that the distribution fits specification limits.
Read the stability comparison →Move through the workflow in order. Each step reduces a different uncertainty before the next conclusion is made.
Use Gage R&R to estimate repeatability, reproducibility, and the system’s ability to distinguish parts.
Use control charts to determine whether the process is behaving consistently over time.
Use Cp and Cpk to compare the stable process distribution with the specification limits.
Use a focused calculator for a quick check, a complete tool for repeated analysis, or the combined suite for the full quality-engineering sequence.
 MSA
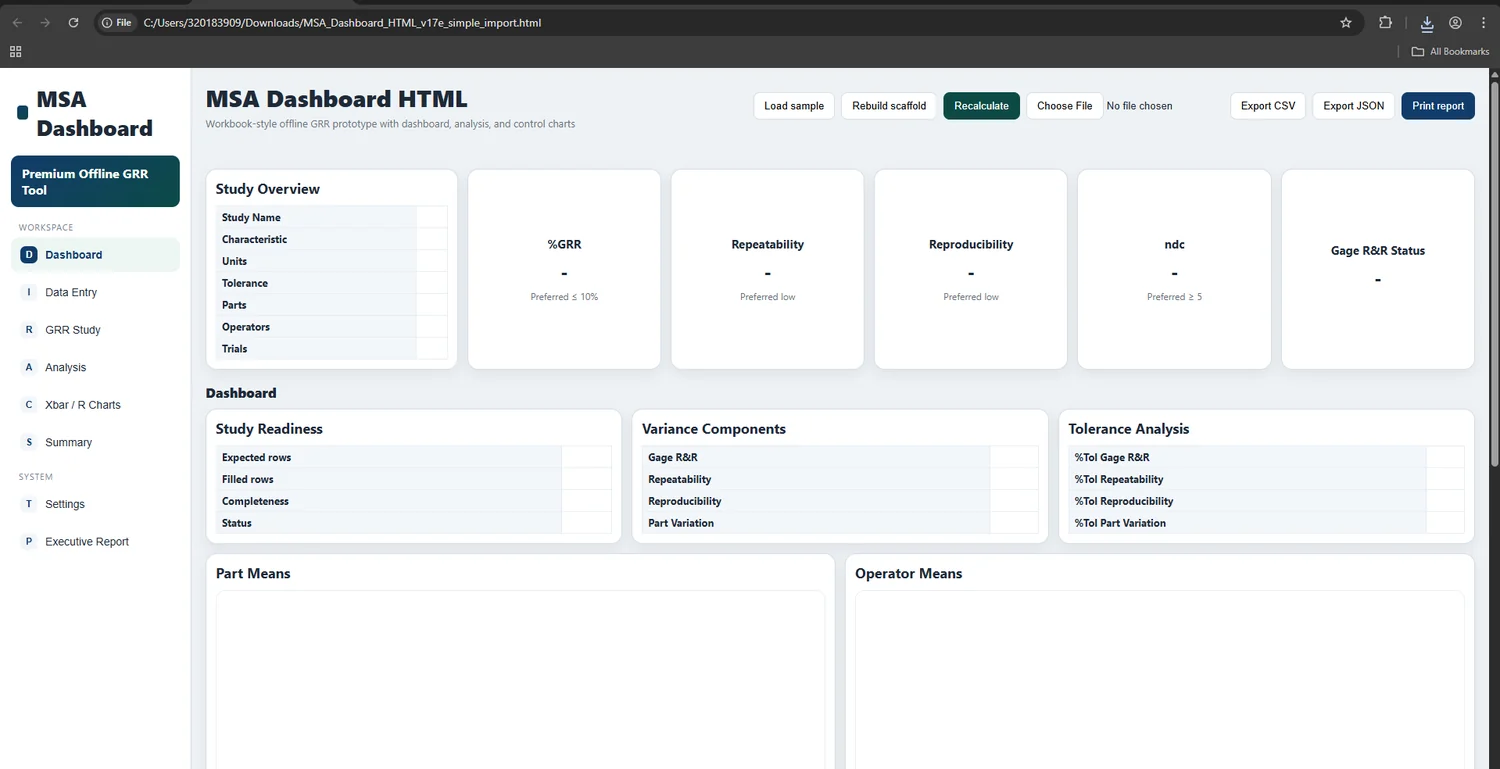
MSACrossed Gage R&R analysis with ANOVA, Average & Range, diagnostic charts, Excel, and local HTML.
View MSA Studio →Calculate %GRR, %Tolerance, repeatability, reproducibility, and ndc using the Average & Range method.
Open the calculator →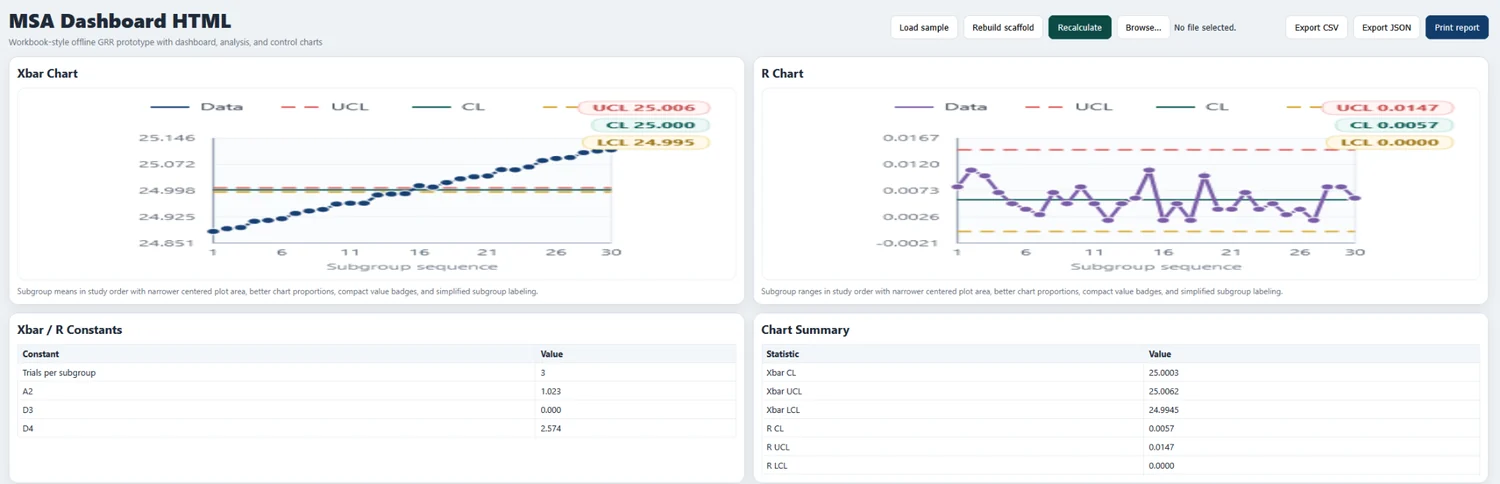 SPC
SPCBuild Xbar and R charts, calculate control limits, and review stability signals.
View SPC Studio →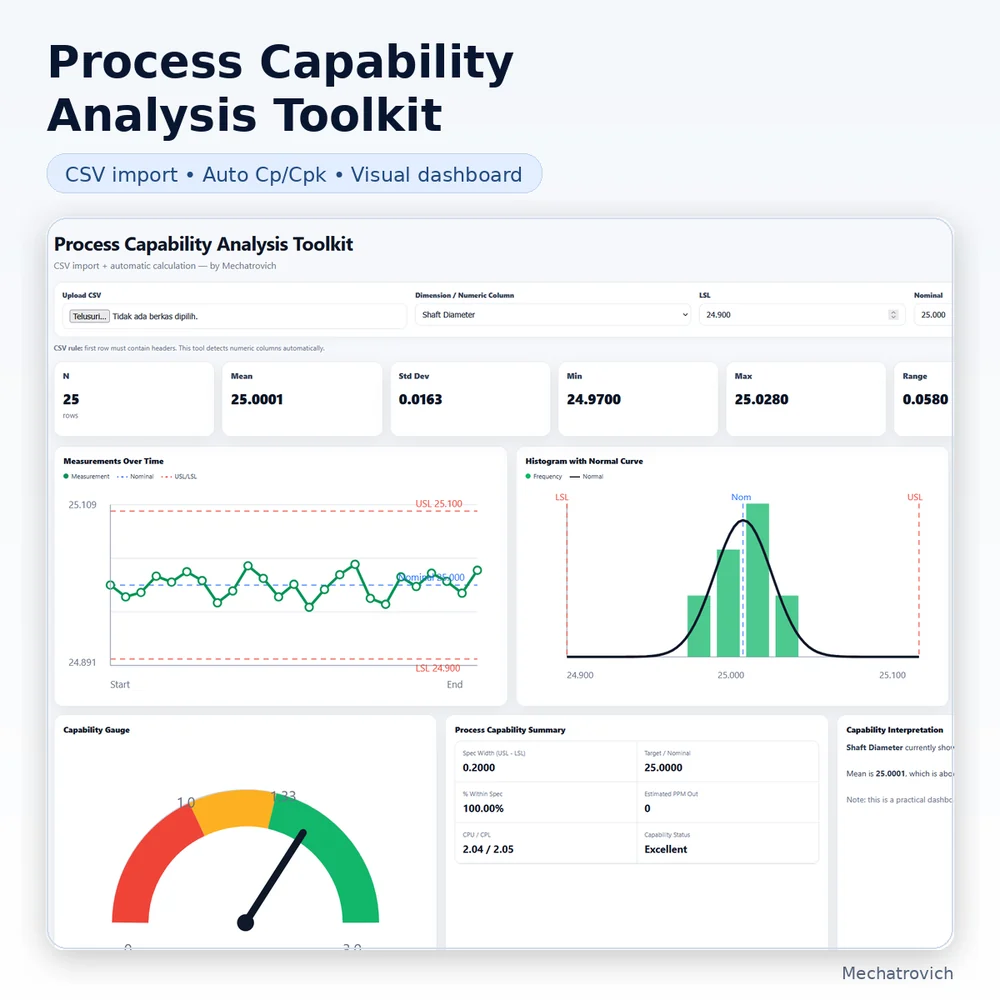 CAPABILITY
Analyze process spread, centering, and capability against specification limits.
View Cpk Dashboard →Use an interpretation review for one existing result or the full analysis sprint when the dataset still needs to be analyzed.
Submit one existing MSA, SPC, or capability output for focused interpretation, risks, limitations, and prioritized next checks.
Submit one manufacturing dataset for a fixed-scope MSA, SPC, capability, or focused combined analysis.
Follow the core pages below before choosing the tool or service that matches the engineering task.
Learn what repeatability, reproducibility, %GRR, and ndc actually measure.
Follow the evidence through ANOVA, diagnostic charts, and the acceptability decision.
Understand rational subgrouping, Xbar and R limits, and signal interpretation.
Compare potential capability, centering, and actual process capability.
See why acceptable measurement, stability, and capability remain separate conclusions.
The sequence is simple, but each method has a different engineering purpose.
Start with Measurement System Analysis, then check process stability with SPC, and only then interpret process capability. This prevents measurement noise or unstable behavior from being mistaken for a capability conclusion.
SPC and capability calculations use measured data. Gage R&R helps determine how much observed variation comes from repeatability and reproducibility before that variation is attributed to the manufacturing process.
Yes. A control chart evaluates whether process behavior is consistent over time. Cpk evaluates how the stable distribution fits the specification limits. A process can be consistently too wide or off-center.
Yes. An acceptable Gage R&R result supports confidence in the measurement. It does not guarantee that the process mean and spread meet the specification.
Use the GRR Calculator when you already have a crossed Average & Range study and need a quick measurement-system check. Use the limited working previews on the SPC Studio and Cpk Dashboard pages for process-stability and capability examples.
Use the Results Interpretation Check when an MSA, SPC, or capability output already exists and the main need is interpretation. Use the Quality Analysis Sprint when the manufacturing dataset still needs the analysis, charts, and engineering conclusions to be produced.